更新日:、 作成日:
エクセル グラフにデータを追加する
はじめに
365202120192016:対応
エクセルのグラフにデータを追加する方法を紹介します。
グラフの範囲を変更できます。Delete キーで削除したり表示したいデータを選択できます。
グラフの作り方については「グラフの作り方」をご覧ください。
データの値を表示するには「グラフにデータの値を表示する」をご覧ください。
データを追加する
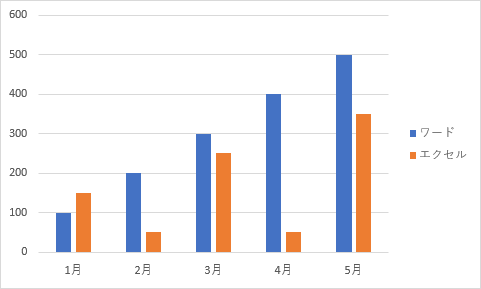
ワードとエクセルのデータを元にして
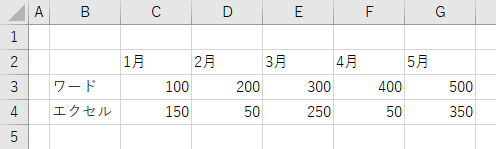
作成されたグラフがあります。
これにアクセスのデータを貼り付ける方法とデータの選択から追加する方法を紹介します。
貼り付けから
アクセスの [データ] をコピーします。

[グラフ] をクリックしてから Ctrl + V キーを入力して貼り付けすると、アクセスのデータがグラフに追加されます。
データの選択から
グラフを選択した状態で [デザイン] タブをクリックし、データグループにある [データの選択] をクリックします。
[グラフデータの範囲] を削除します。
そのまま新しいデータを範囲選択して [OK] をクリックします。
アクセスのデータがグラフに追加されます。
スポンサーリンク
データを削除する
Delete キーで削除する方法とデータの選択から削除する方法を紹介します。
Delete キーから
削除したいグラフの [系列] をクリックします。
Delete キーを入力すると、そのグラフだけが削除されます。
データの選択から
グラフを選択した状態で [デザイン] タブをクリックし、データグループにある [データの選択] をクリックします。
削除したい [系列] をクリックし、[削除] をクリックして [OK] をクリックします。
そのデータを削除できます。
データの非表示や選択する
グラフを選択した状態で [デザイン] タブをクリックし、データグループにある [データの選択] をクリックします。
非表示にしたい [系列] のチェックを外して [OK] をクリックします。
チェックを外したデータが非表示になります。
チェックをするとまた表示されます。
スポンサーリンク